Inter-subject correlation#
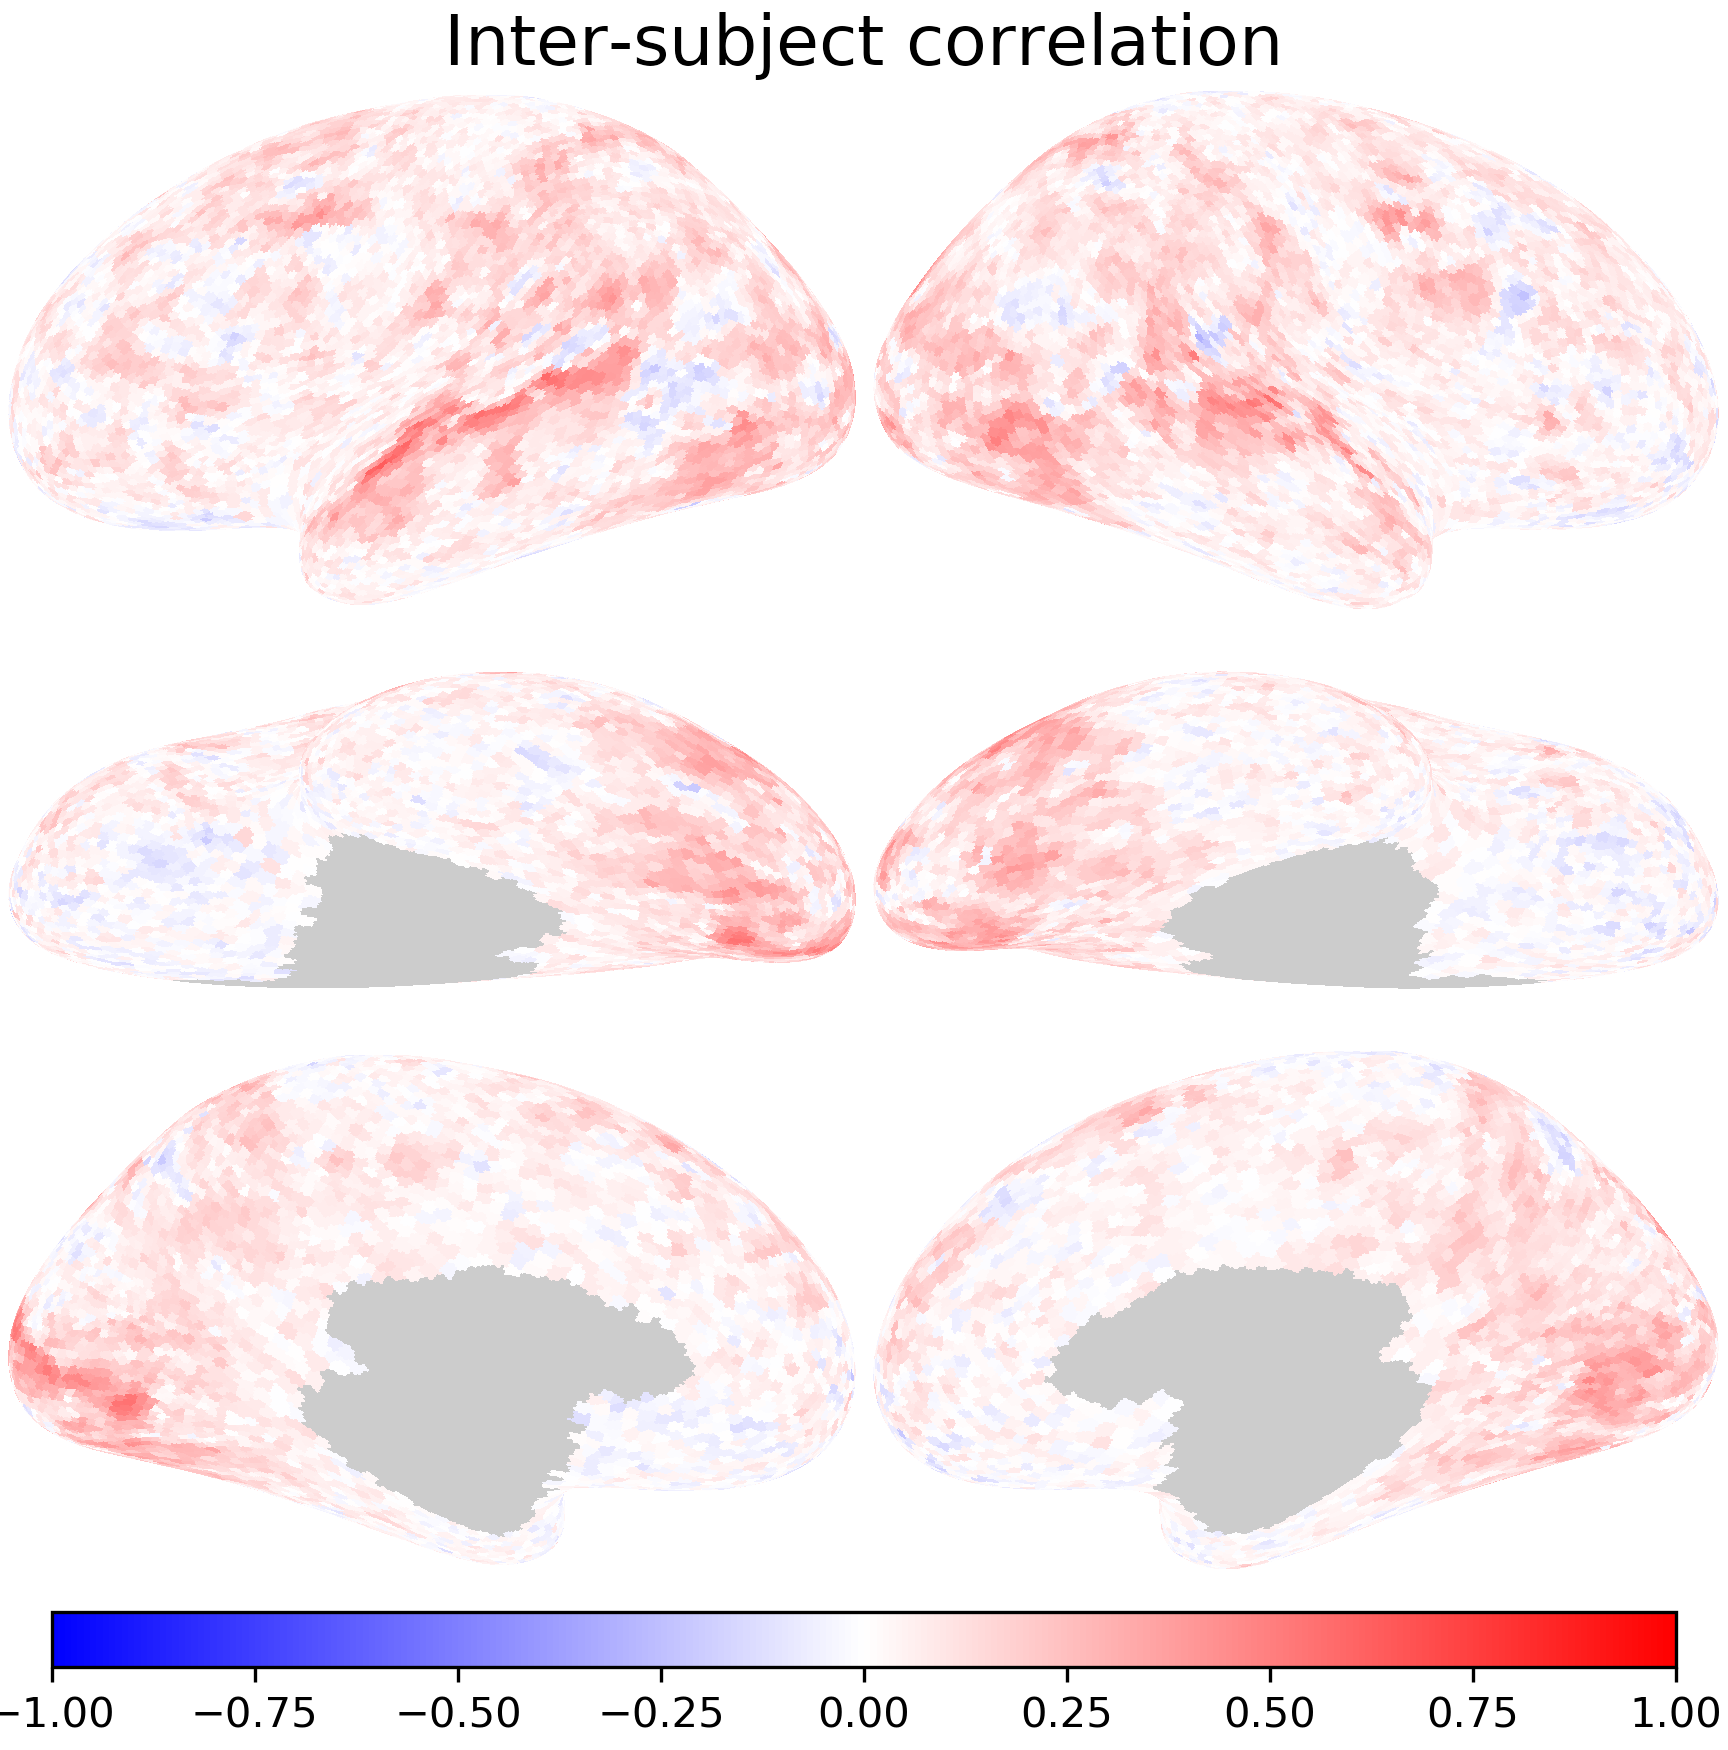
Inter-subject correlation measures to what extent the same location in two brains are synchronized with each other. It is usually quantified using the Pearson correlation between their time series.
import numpy as np
import neuroboros as nb
from scipy.spatial.distance import pdist
from scipy.stats import pearsonr, zscore
import matplotlib.pyplot as plt
dset = nb.Budapest()
sids = dset.subjects
In this example, we use the first two participants’ data matrices. We use data from both hemispheres.
dm1 = dset.get_data(sids[0], 'budapest', 1, 'lr')
dm2 = dset.get_data(sids[1], 'budapest', 1, 'lr')
print(dm1.shape, dm2.shape)
(598, 19341) (598, 19341)
nt, nv = dm1.shape
For each vertex, we compute the correlation between the first participant’s response time series and the second participant’s.
isc = np.zeros((nv,))
for i in range(nv):
    isc[i] = pearsonr(dm1[:, i], dm2[:, i])[0]
The correlation can also be computed using zscored data:
isc2 = np.mean(
    zscore(dm1, axis=0) * zscore(dm2, axis=0),
    axis=0)
np.testing.assert_allclose(isc, isc2)
Exercise#
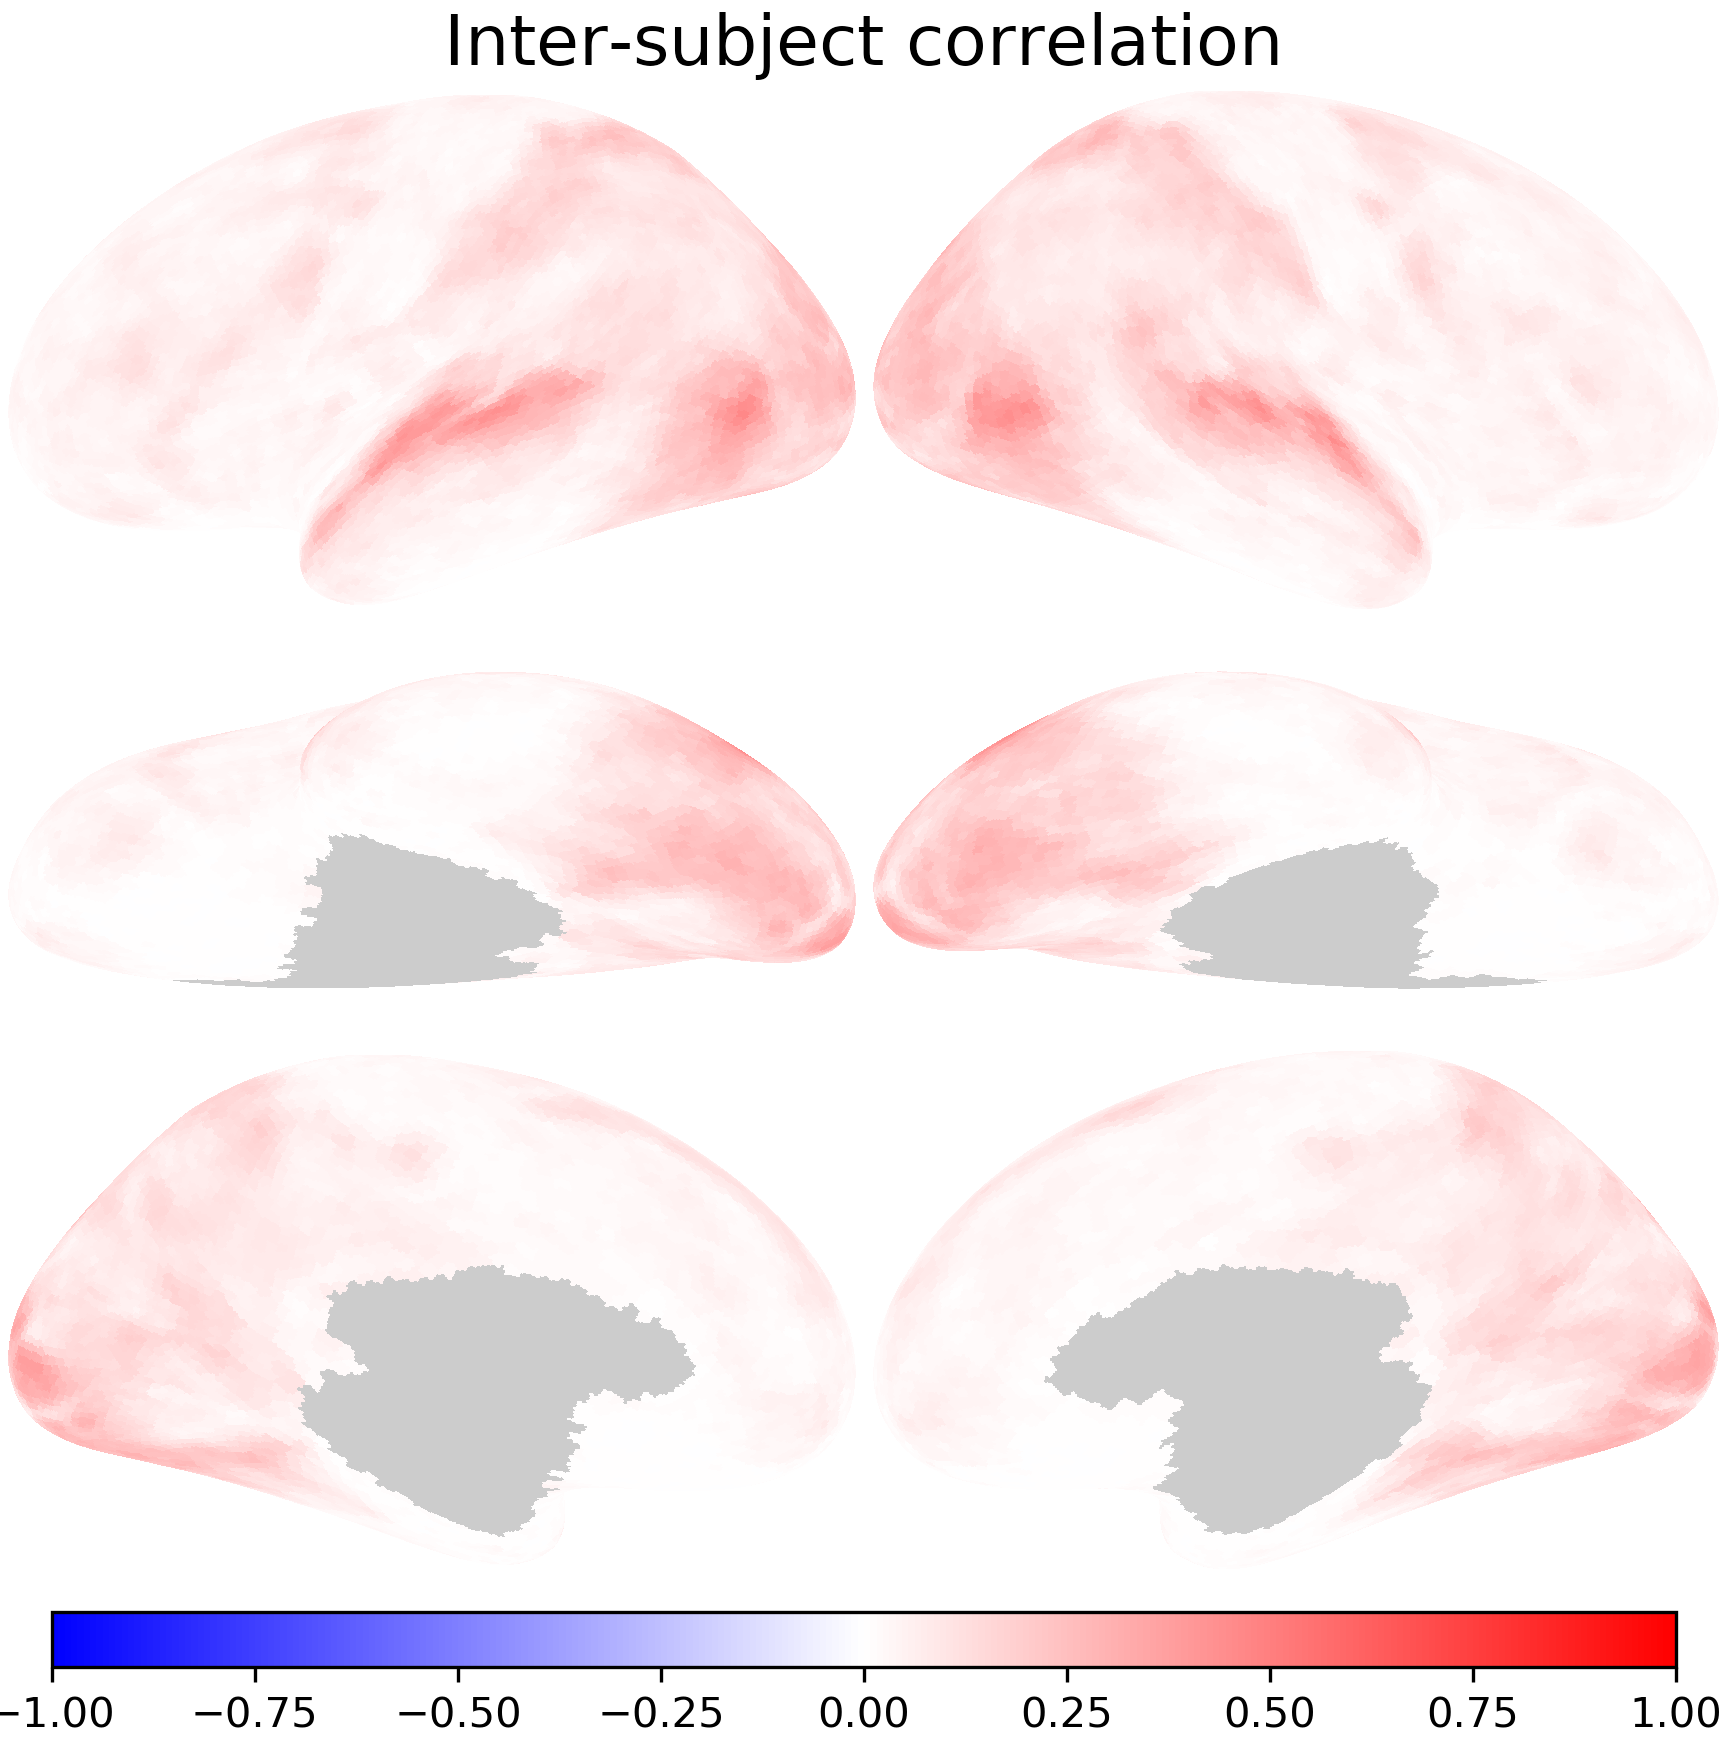
Try to use pdist to compute the average ISC between all pairs of participants and plot the average ISC map using nb.plot.
dms = [dset.get_data(sid, 'budapest', 1, 'lr')
       for sid in sids]
dms = np.stack(dms, axis=0)
dms.shape
(21, 598, 19341)
Show code cell source
isc_all = 1 - np.stack(
    [pdist(dms[:, :, i], 'correlation')
     for i in range(nv)],
    axis=1)
print(isc_all.shape)

avg = np.nanmean(isc_all, axis=0)
(210, 19341)


